
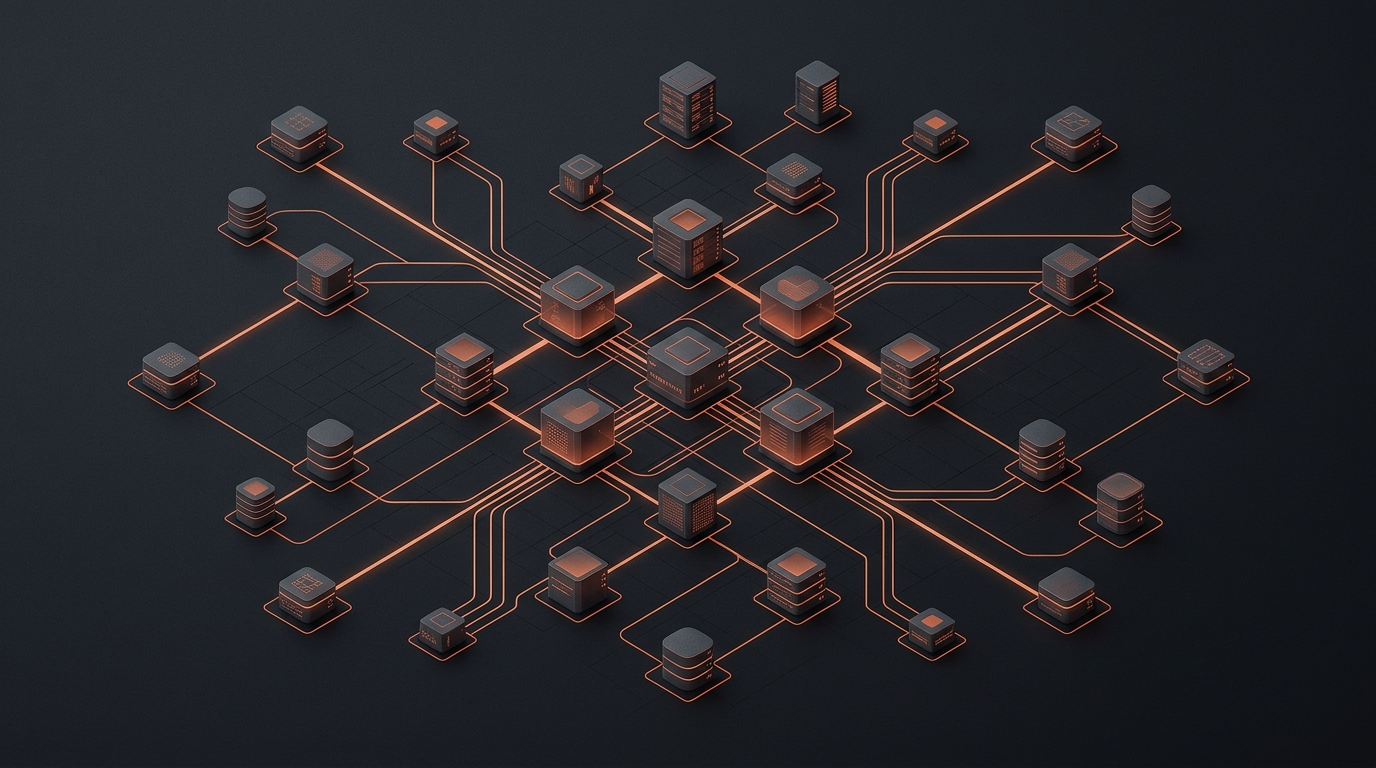
In modern distributed systems, the failure of a single request often cascades through multiple services, queues, and databases. Debugging these interactions using logs alone is rarely sufficient, as logs lack the structural relationship between events across process boundaries. Distributed tracing provides the necessary framework to map these relationships by assigning a unique identifier to a transaction and tracking it as it traverses the infrastructure.
OpenTelemetry (OTel) has emerged as the industry standard for collecting this telemetry data. At its core, OTel relies on the ‘span’—the fundamental building block of a trace. Understanding how spans are constructed, propagated, and sampled is essential for any engineer tasked with maintaining high-availability distributed systems.
The Anatomy of a Span
A span represents a single operation within a trace. It contains the metadata necessary to reconstruct the timing and state of that operation. Key components include a TraceID (the unique identifier for the entire transaction), a SpanID, and a ParentSpanID. This hierarchical structure allows tracing backends to assemble a tree representation of the request execution flow.
Beyond identifiers, spans carry ‘Attributes’ and ‘Events.’ Attributes are key-value pairs used for filtering and aggregation—such as ‘http.method’, ‘db.system’, or ‘peer.service’. Events, conversely, are structured logs attached to a specific timestamp within the span, providing a way to record significant occurrences during the operation’s lifespan without creating a separate span.
Context Propagation: Connecting the Dots
The greatest challenge in distributed tracing is maintaining the trace context as a request moves across process boundaries. When Service A calls Service B via HTTP, the TraceID and ParentSpanID must be injected into the request headers. OTel handles this through ‘Propagators’, which serialize the span context into a standardized format—most commonly W3C Trace Context.
// Example of manual context propagation in a Node.js fetch call
const span = tracer.startSpan('outgoing-request');
const context = trace.setSpan(context.active(), span);

const headers = {};
propagation.inject(context, headers, {
  set: (h, k, v) => h[k] = v
});

await fetch('https://api.service-b.internal', { headers });
span.end();
Without proper propagation, the trace chain breaks. If Service B receives a request without a TraceID, it will start a new root span, effectively creating an ‘orphan’ trace that cannot be linked back to the original client request. This is the most common point of failure in OTel instrumentation.
Trade-offs: Sampling Strategies
Tracing every single request in a high-throughput system can introduce significant overhead, both in network bandwidth and storage costs. To mitigate this, engineers employ sampling. Head-based sampling, where the decision to trace is made at the start of the request, is the simplest implementation but can miss rare, high-latency errors.
Tail-based sampling is the more robust, albeit complex, alternative. In this model, all spans for a trace are collected, and the decision to keep or drop the trace is made after the entire trace is completed. This allows for conditional logic, such as ‘always keep traces that contain an error or exceed 500ms latency.’ This requires an OTel Collector to buffer the data, introducing a trade-off between memory usage and observability fidelity.
Instrumentation Best Practices
- Avoid high-cardinality attributes: Do not put user IDs or unique request IDs into span names, as this will explode the index size in your backend.
- Use semantic conventions: Adhere to OTel’s official semantic conventions to ensure that your dashboards and alerts remain consistent across different services and teams.
- Instrument infrastructure, not just code: Ensure your database drivers, message queues, and HTTP clients are properly instrumented via OTel auto-instrumentation libraries before writing custom spans.
Conclusion
Distributed tracing is not merely about visualizing request flows; it is about establishing a causal map of your system’s behavior. By leveraging OpenTelemetry spans, engineers move from reactive log-grepping to proactive analysis of system bottlenecks and failures. While the implementation of sampling and propagation requires careful design, the investment yields a significant reduction in mean-time-to-resolution (MTTR) for complex production incidents.