
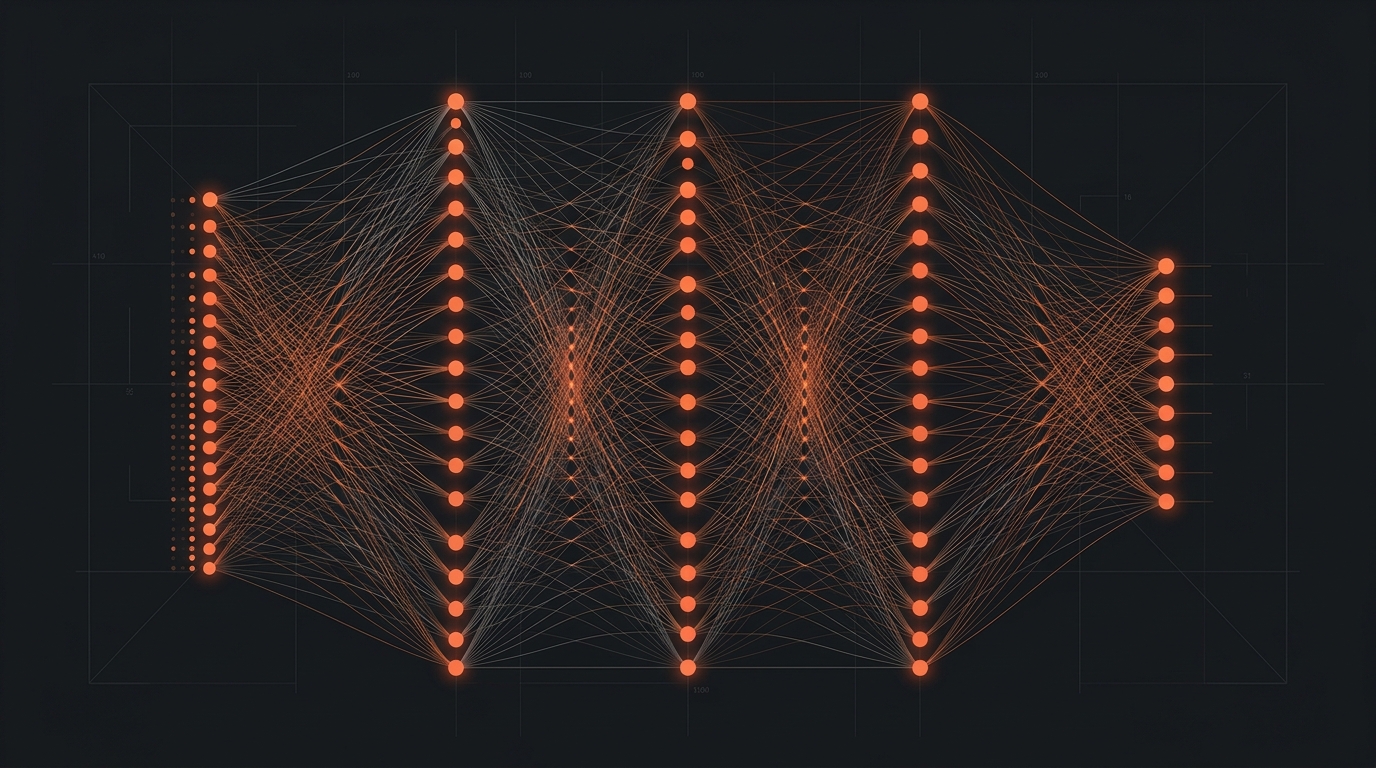
The modern transformer [architecture](/blog/why-your-architecture-now-matters-more-than-your-model), while theoretically well-understood, often manifests as an opaque ‘black box’ when implemented in production. As models grow in depth and complexity—incorporating mixture-of-experts (MoE) layers, cross-attention mechanisms, and complex residual pathways—the ability to inspect the structural topology becomes a critical requirement for debugging and architectural optimization.
By moving beyond static model summaries and utilizing programmatic inspection of the ‘config.json’ and state dicts, we can generate interactive, animated visualizations that reveal the actual flow of tensors through the graph. This article explores how to bridge the gap between abstract architectural diagrams and the concrete reality of a serialized model file.
Deconstructing the Model Graph
Every HuggingFace model is essentially a directed acyclic graph (DAG) of modules. To visualize this, we must traverse the ‘nn.Module’ hierarchy provided by PyTorch. The challenge lies in identifying the meaningful boundaries between layers while abstracting away the repetitive implementation details that clutter the visual representation.
import torch
from transformers import AutoModel

model = AutoModel.from_pretrained("bert-base-uncased")

def get_module_graph(module, prefix=""):
    graph = []
    for name, child in module.named_children():
        node_name = f"{prefix}.{name}" if prefix else name
        graph.append({"id": node_name, "type": type(child).__name__})
        graph.extend(get_module_graph(child, node_name))
    return graph
The recursive approach above captures the structure, but a raw tree traversal is insufficient for complex [architectures](/blog/building-resilient-edge-architectures-the-backbone-of-industrial-aiot). We must also account for residual connections and skip pathways, which are often implicit in the ‘forward’ method rather than explicit in the object hierarchy.
Mapping Hidden States and Residual Flows
To create an animated visualization, we need to map the data flow. This involves hooking into the forward pass to capture the shapes and activations as they propagate. By registering ‘forward_hooks’ on specific modules, we can capture the metadata necessary to animate the tensor movement across the network.
The goal is not just to see the static architecture, but to understand the dynamic transformation of the hidden state as it traverses the stack of transformer blocks.
Handling Mixture-of-Experts (MoE)
MoE architectures introduce a dynamic routing layer that changes the active path based on the input token. Visualizing this requires a conditional graph where edges are weighted by the router’s probability distribution. When animating, the edge thickness should fluctuate in real-time, representing the load distribution across different expert networks.
Interactive Visualization Strategies
Once we have the graph structure, we need an interactive frontend to display it. Using D3.js or React Flow allows us to handle thousands of nodes while providing zoom, pan, and collapsible layer functionality. For animation, we can use an interpolation engine to simulate the ‘pulse’ of data moving from the embedding layer to the output head.
- Force-directed layouts to automatically organize complex clusters.
- Layer-based layering (Sugiyama algorithm) to emphasize the sequential nature of depth.
- Temporal animation to show the iterative update of attention scores.
Trade-offs and Limitations
Visualizing every single operation (e.g., individual matrix multiplications) leads to cognitive overload and performance degradation in the browser. A high-fidelity visualization requires a strategy of ‘semantic zooming,’ where lower-level details are hidden unless the user explicitly expands a specific block.
Furthermore, static analysis of the graph may not capture dynamic execution patterns in models with branching logic. We must supplement structural analysis with runtime trace data to ensure the visualization remains grounded in actual model behavior.
Conclusion
Visualizing HuggingFace architectures is more than a pedagogical exercise; it is a critical tool for model interpretability. By programmatically extracting the graph and applying interactive frontend techniques, we can transform abstract tensor operations into observable, debuggable, and intuitive structural maps. As models continue to scale in architectural complexity, these visual tools will become indispensable for the modern AI engineer.